The 1.1 MB icon font
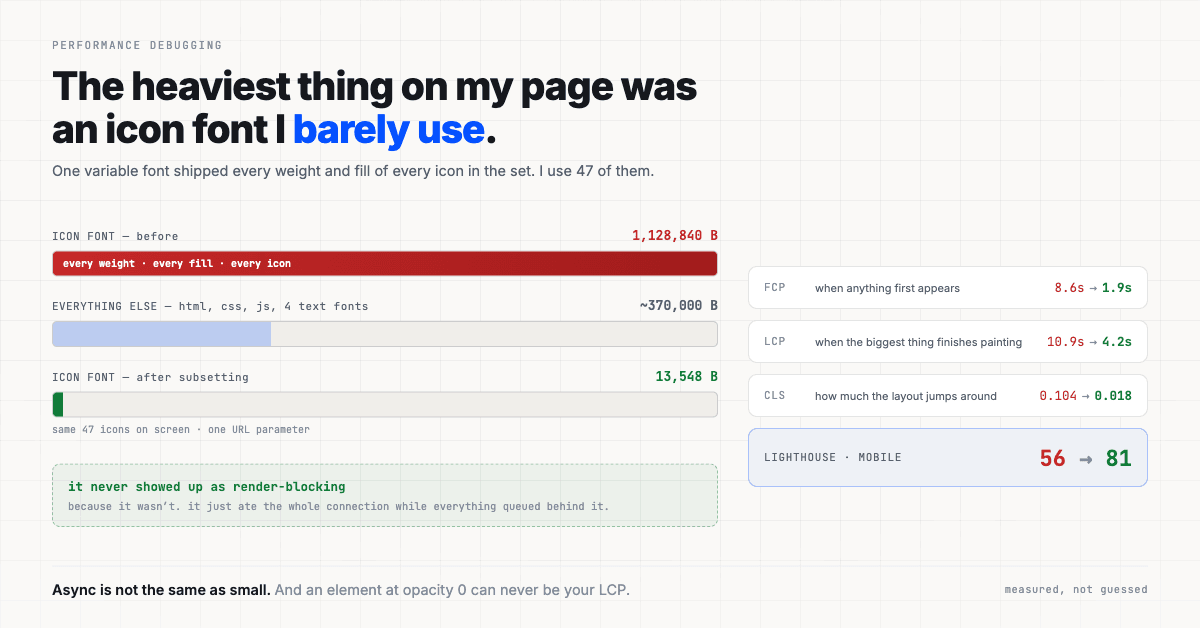
The icon font was 1.1 MB. Everything else on the page — the HTML, the CSS, all the JavaScript, and four text fonts — came to about 370 KB combined.
Icon sets like Material Symbols ship as variable fonts: a single file holding every weight and every fill state of every icon in the set. Request it without narrowing anything down and you get all of it. Thousands of icons. I use 47.
The fix was one URL parameter
Google Fonts will hand you a subset if you ask for one. Pin the axes to single values instead of ranges, and list the icons you actually use:
<!-- before — every weight, every fill, every icon -->
<link href="https://fonts.googleapis.com/css2?family=Material+Symbols+Outlined:wght,FILL@100..700,0..1" rel="stylesheet">

<!-- after — pinned axes, 47 named icons -->
<link href="https://fonts.googleapis.com/css2?family=Material+Symbols+Outlined:opsz,wght,FILL,GRAD@24,400,0,0&icon_names=add_circle,arrow_back,code,shield,terminal" rel="stylesheet">
Same icons on screen. Nothing else changed.
| Metric | Before | After |
|---|---|---|
| Icon font | 1,128,840 B | 13,548 B |
| First Contentful Paint | 8.6 s | 1.9 s |
| Largest Contentful Paint | 10.9 s | 4.2 s |
| Lighthouse, mobile | 56 | 81 |
The stylesheet was already loaded asynchronously, so it never appeared in any "render blocking resources" list. And it genuinely wasn't blocking. It just ate the whole connection while everything else queued behind it. Non-blocking and small are different properties, and only one of them was true.
An element at opacity 0 can never be your LCP
My page title animated in from opacity: 0. Largest Contentful Paint measures when the biggest visible thing on screen finishes painting — and an element at opacity 0 is not visible, so the browser refuses to count it.
My LCP was never slow. It was sitting there waiting for a one second fade to finish before it was allowed to start measuring.
// before — invisible until the animation ends, so LCP waits it out
const heroTitle = { hidden: { opacity: 0, y: 40, filter: "blur(10px)" } };

// after — painted in the server HTML, still moves
const heroTitle = { hidden: { opacity: 1, y: 14 } };
Lighthouse's observed metrics confirmed it afterwards: first contentful paint and largest contentful paint became the same event, 118 ms apart from nothing.
Then my own fix broke something else
Subsetted icons arrive a moment later than the rest of the page. I had not reserved space for them, so each icon resized on arrival and shoved the layout around. Cumulative Layout Shift went from 0.014 to 0.104 — straight from good to failing.
.material-symbols-outlined {
  /* reserve the glyph box, or every icon reflows the page when it lands */
  display: inline-block;
  width: 1em;
  height: 1em;
  line-height: 1;
  overflow: hidden;
}
Back to 0.018.
What I took away
- The heaviest asset on a page is often the one nobody thinks to look at.
- Asynchronous does not mean cheap.
- Fixing one metric can quietly break another, so re-measure all of them after every change.
Production score is 81 now, up from 56. The remaining work is JavaScript, which is a harder problem than a URL parameter.